Climate Science 101: Why Carbon Matters (more than other GHGs like Methane)?

Hi All,
Today, I wanted to discuss why scientists are obsessed with reducing carbon (CO2) from the atmosphere despite there are many other toxic greenhouse gases in the air - not to mention water vaper (H20) being the biggest heat-trapping gas in fact.
The short answer is two-fold: 1) CO2 has contributed more than any other drivers to climate change between 1750 and now, and 2) it is sticky - it stays longer than other greenhouse gases in the atmosphere.
I will try to address the topic in a Q & A foramt. Let's go!
Q: How do you determine which greenhouse gases are more harmful?
A: Carbon dioxide (CO2) is not the most potent greenhouse gas, but it is the most abundant and longest-lasting in the atmosphere. While other greenhouse gases such as methane (CH4) and nitrous oxide (N2O) have higher global warming potentials, they are present in much smaller concentrations and have shorter atmospheric lifetimes. CO2, on the other hand, is relatively stable in the atmosphere and persists for centuries to millennia.
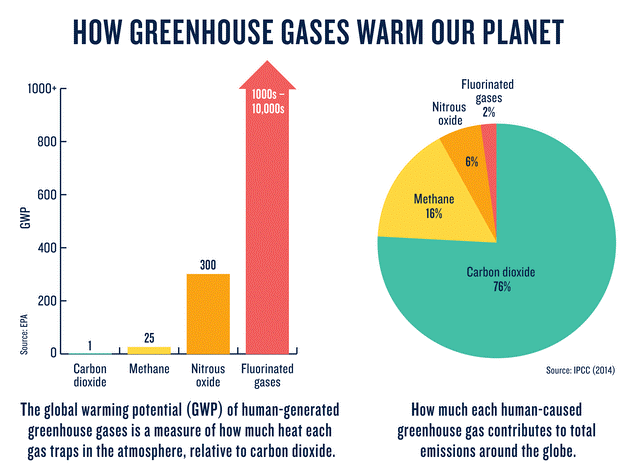
Q: What are Global Warming Potentials (GWP) and how do they work?
A: GWPs are a way of comparing the warming effect of different greenhouse gases relative to carbon dioxide (CO2), which is used as a reference gas with a GWP of 1.
For example, the GWP of methane is 28 over a 100-year time horizon, which means that methane is 28 times more effective at trapping heat in the atmosphere than carbon dioxide over that period. This is because methane has a shorter atmospheric lifetime than CO2, but it is more potent while it lasts.
The GWP concept was developed by the Intergovernmental Panel on Climate Change (IPCC) and is used by organizations such as the U.S. Environmental Protection Agency (EPA) to assess the climate impact of different gases and to develop policies to reduce greenhouse gas emissions.
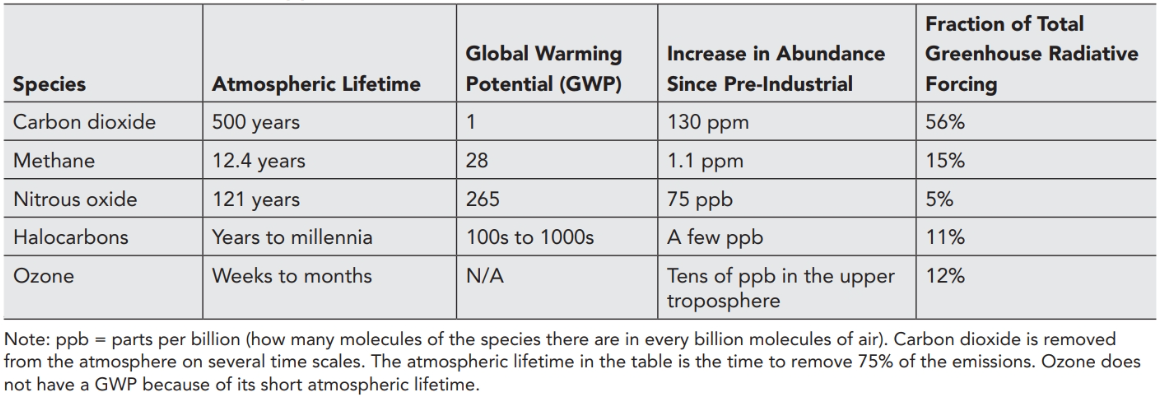
[Metrics of major greenhouse gases. Increases in abundance and fraction of heating for the years 1750–2010]
The GWP concept allows policymakers to compare the climate impact of different greenhouse gases and to prioritize actions to reduce emissions of the most potent gases. It also helps to account for the long-term impacts of emissions, as some gases, such as fluorinated gases, can persist in the atmosphere for centuries or even millennia.
Overall, the GWP concept is an important tool for understanding the relative impacts of different greenhouse gases and for developing effective policies to address climate change.
Q: What do people mean when they say '418.6 ppm CO2'?
A: A concentration of 418.6ppm means that for every million air particles, 418.6 of them are carbon dioxide molecules (0.04186%). ppm stands for parts per million (ppm).
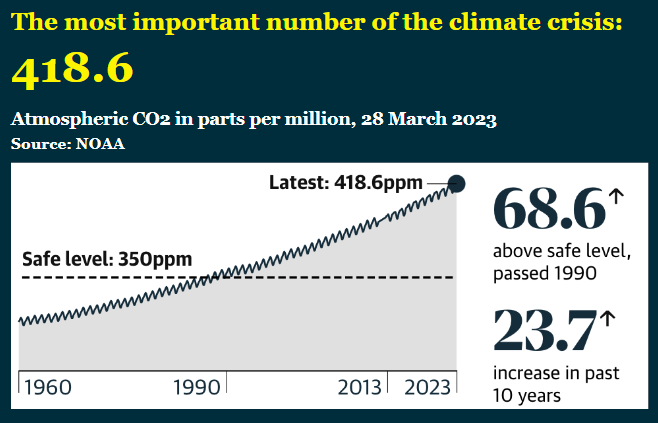
The concentration of CO2 in the atmosphere has risen significantly since the industrial revolution, primarily due to human activities such as burning fossil fuels, deforestation, and land use changes. Before the industrial revolution, the concentration of CO2 in the atmosphere was around 280 parts per million (ppm). Today, it is over 418ppm (updated as of March 28, 2023), which is the highest level in at least 800,000 years.
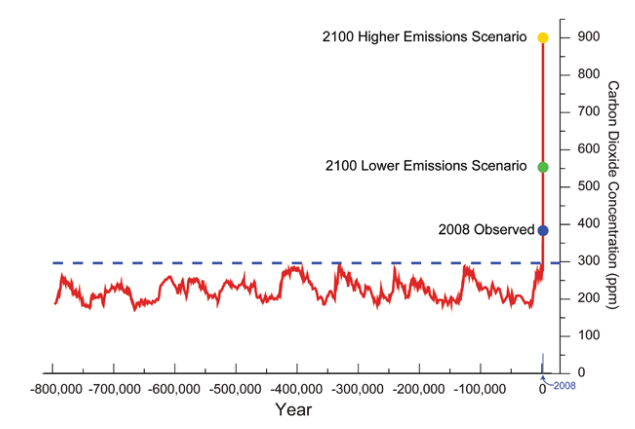
Figure 1 below shows the atmospheric concentration of carbon dioxide in the past 800,000 years (data have come from ice cores, direct measurements in recent years etc., if you're interested in this, read ‘The two-mile time machine’ by Richard B. Alley) and various estimates of how carbon dioxide concentrations will behave over the coming decades, depending on how we react to legislation on carbon emissions
Figure 1. The global atmospheric concentration of CO2 in parts per million (ppm) measured over the past 800,000 years from ice cores and instrumental records and estimated for 2100 using simulations. The dashed blue line shows "pre-industrial" concentrations of around 290 ppm.
Burning fossil fuels is the primary source of CO2 emissions, accounting for around 70% of global emissions. Deforestation and land use changes are also significant sources, contributing around 10-15% of global emissions. Other sources of CO2 emissions include industrial processes, transportation, and agriculture.
To limit global warming to 1.5°C above pre-industrial levels and avoid the most severe impacts of climate change, a carbon budget has been established. This carbon budget represents the total amount of CO2 that can be emitted into the atmosphere before the global temperature threshold is exceeded. Many countries, including the United States, have committed to reaching net zero emissions by mid-century to stay within this carbon budget and limit global warming.
Reducing CO2 emissions requires a combination of strategies, including renewable energy, energy efficiency, and carbon capture and storage. Renewable energy sources such as solar, wind, and hydropower emit little to no CO2 during operation, making them a crucial part of the solution. Energy efficiency measures, such as improving building insulation and using more efficient appliances, can also significantly reduce energy demand and CO2 emissions. Finally, carbon capture and storage technologies can capture CO2 from industrial processes and power plants and store it underground, reducing emissions from these sources.
Q: How much is a Metric Ton (Tonne)?
A: Overall, while CO2 is not the only greenhouse gas that contributes to climate change, it is the most significant and well-studied. Yet, people often ask how much is a metric tonne? Investors often see 'metric tonne' as a unit of their portfolio's carbon footprint, but it is hard to wrap our heads around what this number means. Bill Gates noted in his book - one number for us to remember is '51bn tonnes of greenhouse gases' that we need to stop emitting each year to achieve net carbon zero emissions by 2050. But again, people still struggle to understand how much of carbon that is.
A metric ton of carbon dioxide (also known as a "tonne" of carbon dioxide) is a unit of measurement that represents the amount of CO2 emissions produced by a specific activity or source. One metric ton of carbon dioxide is equivalent to releasing 1,000 kilograms (or 2,204.6 pounds) of CO2 into the atmosphere.
To help put this into perspective, according to the U.S. Environmental Protection Agency (EPA) and the United Nations Framework Convention on Climate Change (UNFCCC), the average passenger car emits around 4.6 metric tons of CO2 per year, while the average American household (sorry - non-American readers here; will try to add global perspectives in the future posts) emits around 16 metric tons of CO2 per year. In terms of global emissions, humans currently emit over 40 billion metric tons of CO2 into the atmosphere each year, which is causing significant impacts on the Earth's climate and ecosystems.
- Burning one gallon of gasoline produces about 20 pounds (or 9 kilograms) of CO2, which means that driving a car that gets 25 miles per gallon for one year would produce about 4.6 metric tons of CO2 emissions.
- A round-trip flight from New York to Los Angeles for one passenger produces approximately 1 metric ton of CO2 emissions.
- The production of one metric ton of steel results in around 1.8 metric tons of CO2 emissions, while the production of one metric ton of cement results in around 0.9 metric tons of CO2 emissions.
- The average American consumes around 7 metric tons of CO2 emissions per year through their diet, mainly from the production of meat and dairy products.
- One large tree can absorb about 1 metric ton of CO2 over its lifetime, while a typical acre of forest can absorb around 2.5 to 5 metric tons of CO2 per year.
Helpful Resources:
1) You can check out the Greenhouse gas equivalencies calculator by US EPA here.
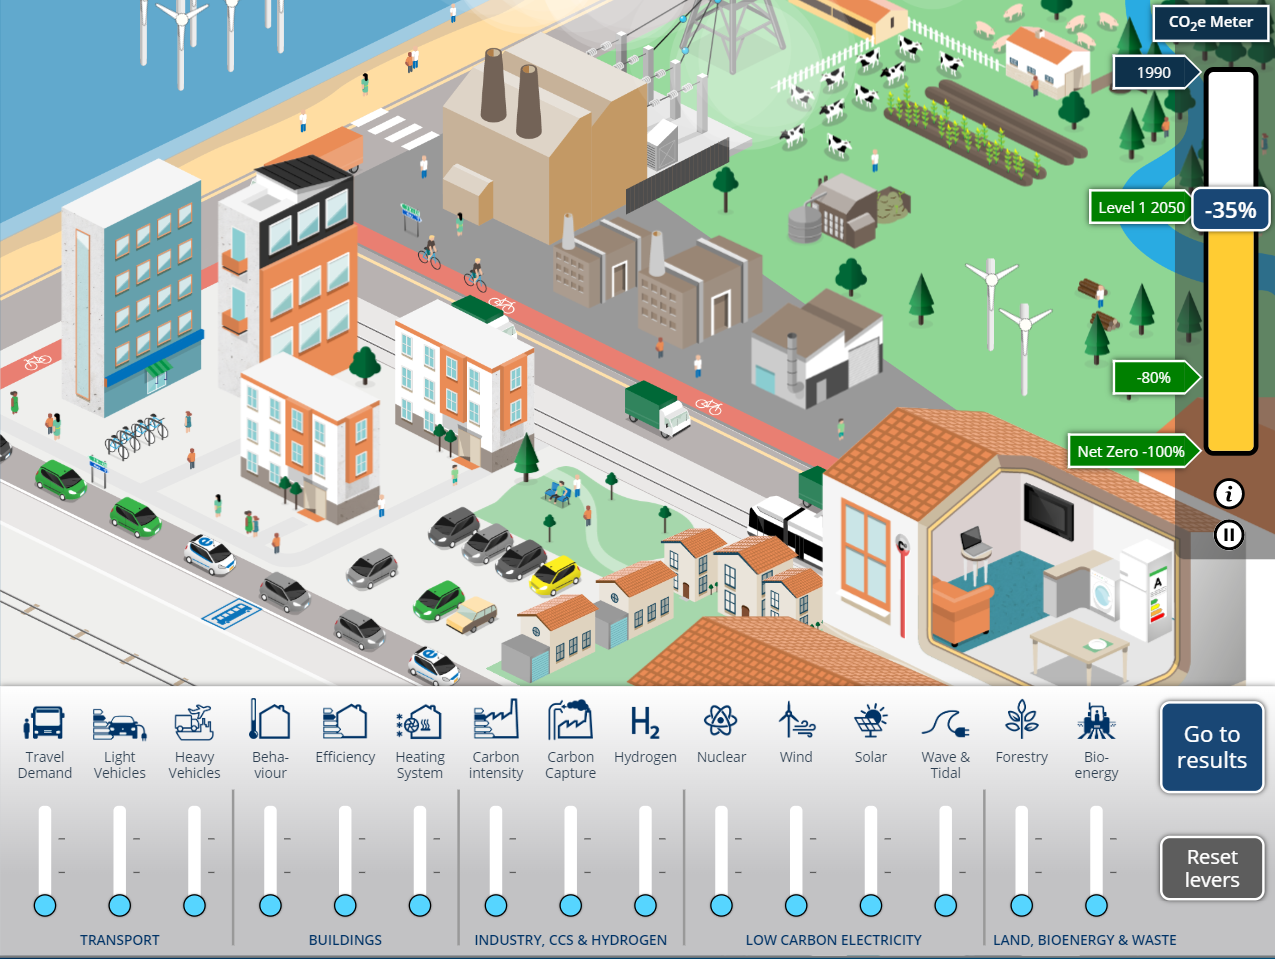
2) The MacKay Carbon Calculator provides a model of the UK energy system that allows you to explore pathways to decarbonisation, including net zero by 2050.
3) Here are some places where you can calculate your individual carbon footprint. WWF Footprint Calculator & Carbon footprint calculator
Many organizations, governments, and businesses use metric tons of CO2 as a way to measure and track their carbon footprint, or the amount of greenhouse gases they are responsible for emitting. By understanding how much CO2 they are producing, they can take steps to reduce their emissions and contribute to the fight against climate change.
Overall, while a metric ton of carbon dioxide may seem like a small unit of measurement, its impact on the Earth's climate can be significant, and reducing our emissions is crucial for the health of the planet and future generations.
Q: Which countries have the highest carbon emissions?
This video by Carbon Brief (Oxford University affiliate) shows the time-lapse of which country has been emitting CO2 the most between 1750 and 2019.
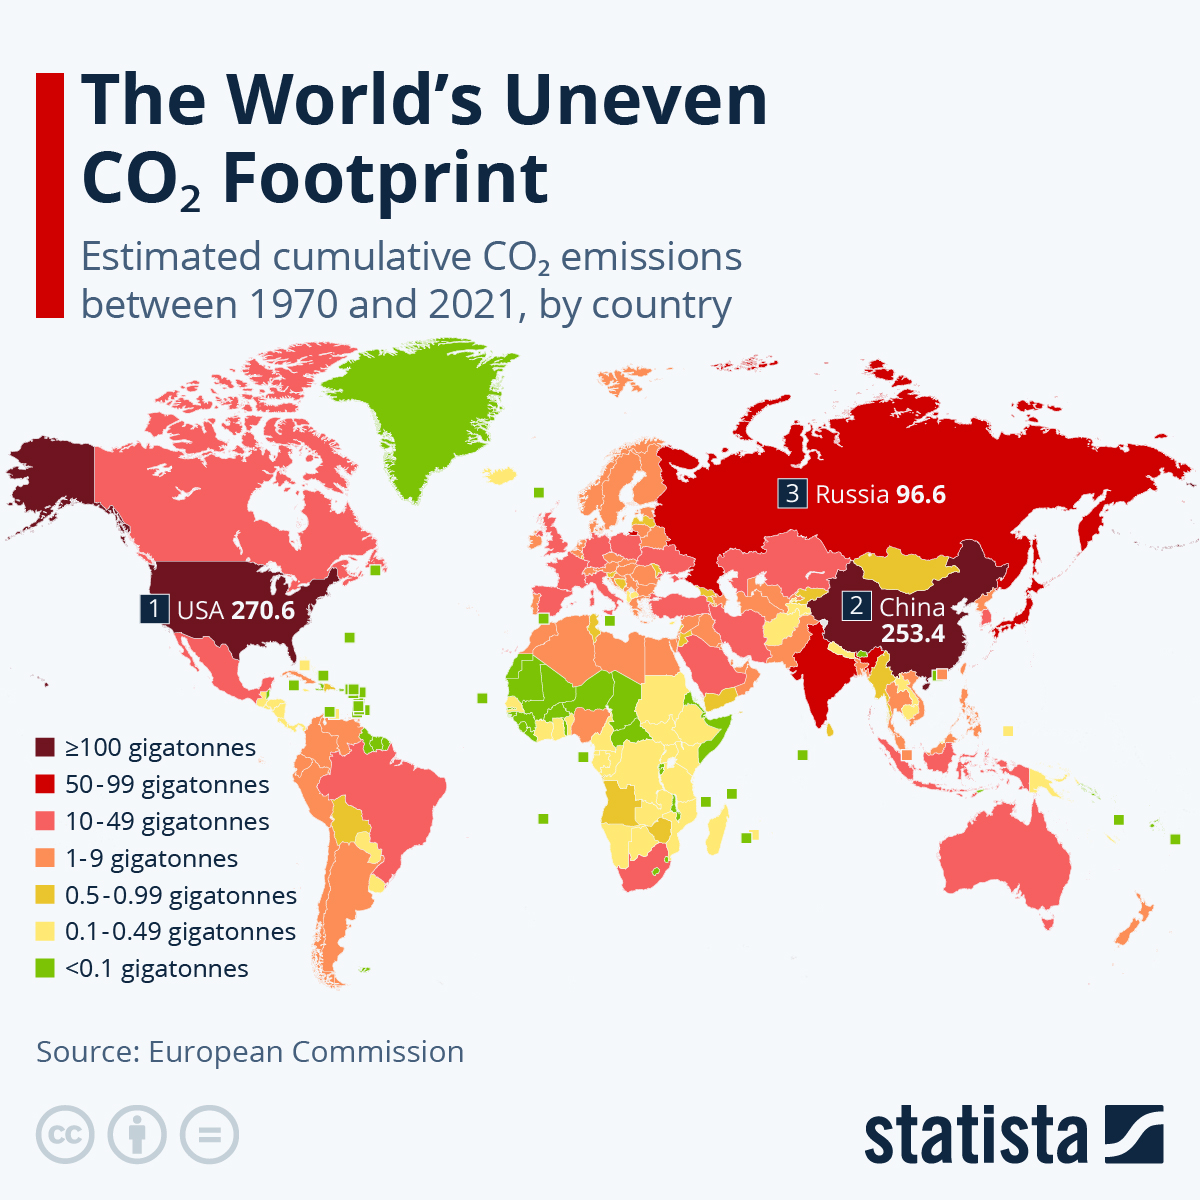
According to data shown below from the European Commission’s Emissions Database for Global Atmospheric Research (EDGAR), African nations have contributed the least to the accumulation of heat-trapping gases in the atmosphere, while the United States, China, and Russia have been responsible for the highest emissions of carbon dioxide since 1970.
In closing, last year's UN climate summit highlights the issue of loss and damage, an urgent matter that developing nations have been advocating for, as they are the most vulnerable and least capable of adapting to the impacts of climate change, despite contributing the least to the problem. With Africa accounting for a 3% of global CO2 emissions yet disproportionately affected by climate change, the need for climate justice is pressing. African leaders at COP27 have emphasized the clear difference in culpability and capacity, underscoring the need for a just net zero transition to address climate change risks.
This is something we all need to think about. What would the 'just' net zero transition look like? Please share your thought!
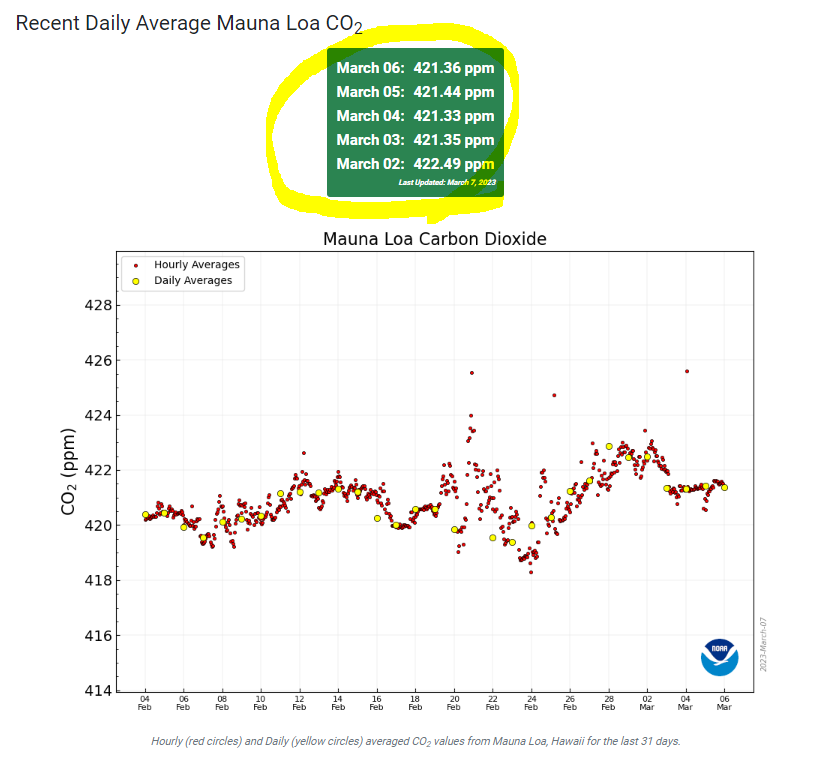
P.S. If you want to monitor the daily atmospheric carbon concentration level, you can visit this website run by the Mauna Loa Observatory in Hawai'i, the US.
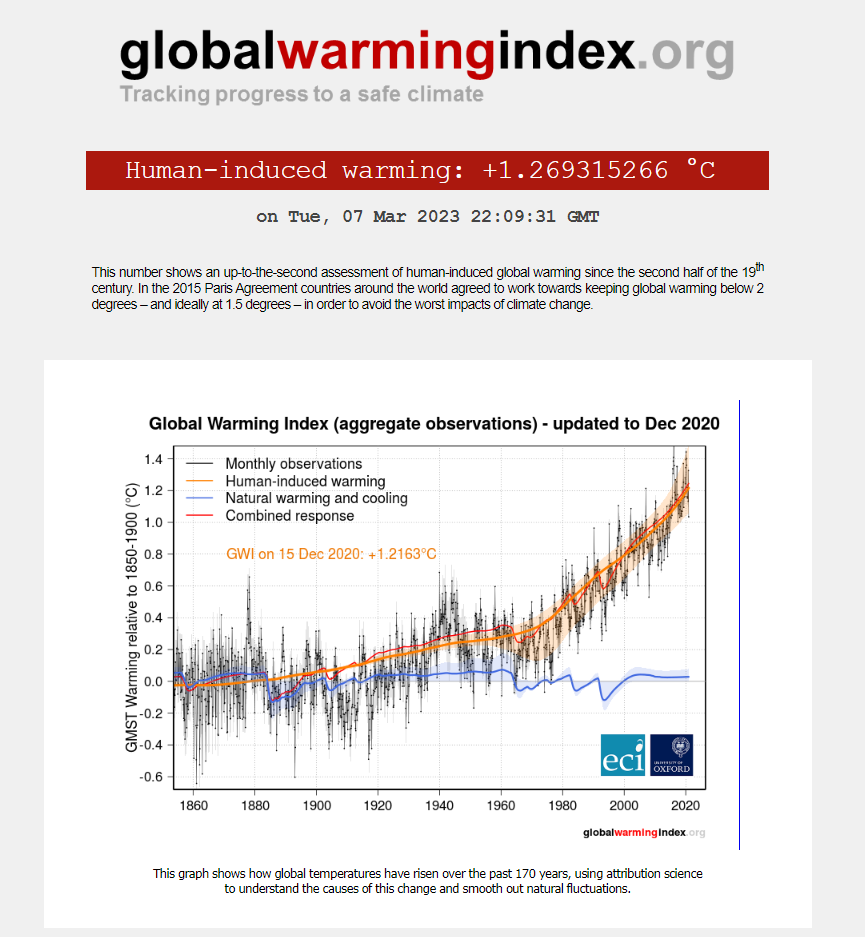
You can also check the global warming index (daily updated) by Oxford University and ECI.